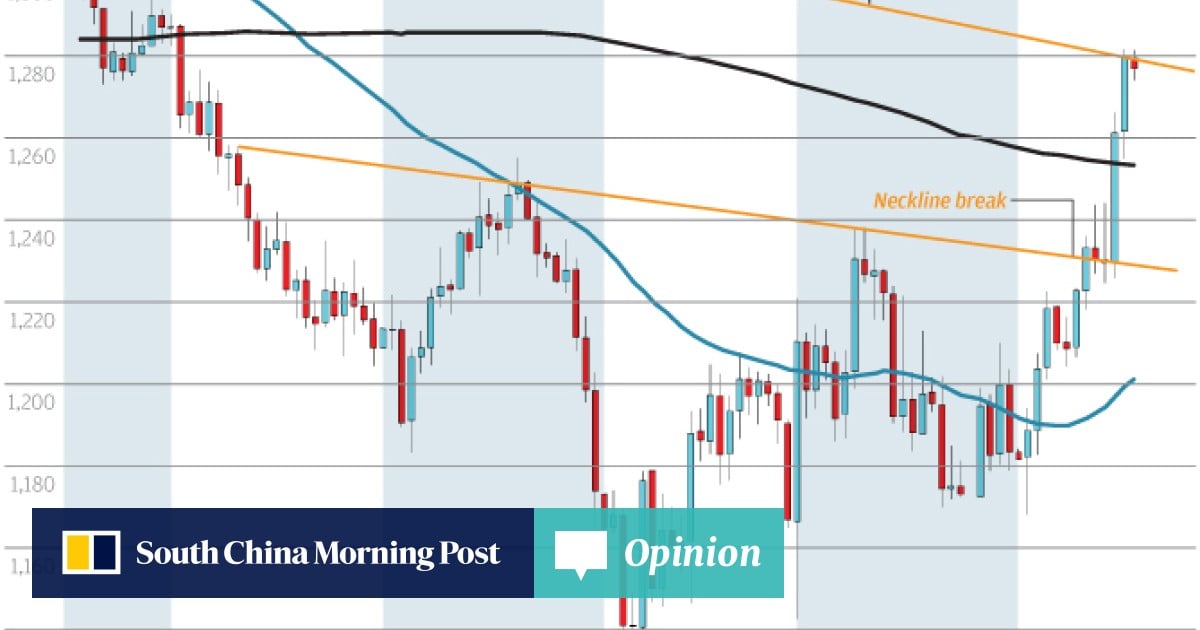
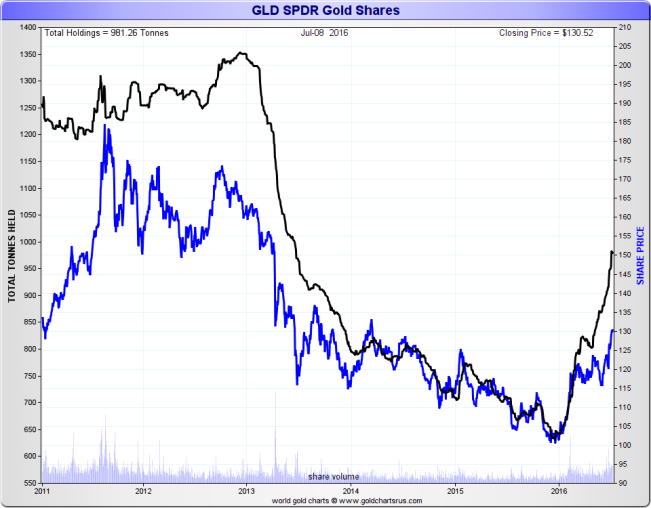
Alright, folks, let’s cut through the noise and get straight to the point. The latest brokerage order flow data is screaming at us, and you need to pay attention. Gold is hitting a wall, with crucial resistance levels piling up around 3334.5 and beyond. Don’t get caught chasing a rally into a brick wall!
Now, let’s talk oil. Forget the optimistic chatter. We’re seeing a decidedly strong downward momentum in crude – a bearish signal you can’t ignore. Those hoping for a quick bounce higher are likely to be disappointed.
And finally, a word of caution on GBP/USD. I’m spotting potential traps for short sellers. Be extremely wary of getting ambushed – the market might be baiting you into premature ‘short’ positions.
Diving Deeper: Understanding Order Flow & Resistance
Order flow analysis is about tracking where the real money is going. Brokerage order data reveals accumulation and distribution patterns. It’s a canary in the coal mine for price movements.
Resistance levels represent price points where selling pressure has historically overcome buying interest. They act like ceilings, preventing further upward momentum. Identifying these is crucial.
Strong downward momentum in a commodity like oil means sellers are dominant. This isn’t just about supply and demand; it’s about broader market sentiment and risk appetite.
Be smart, be cautious, and protect your capital. Click here to view the full report for detailed analysis and actionable strategies.


