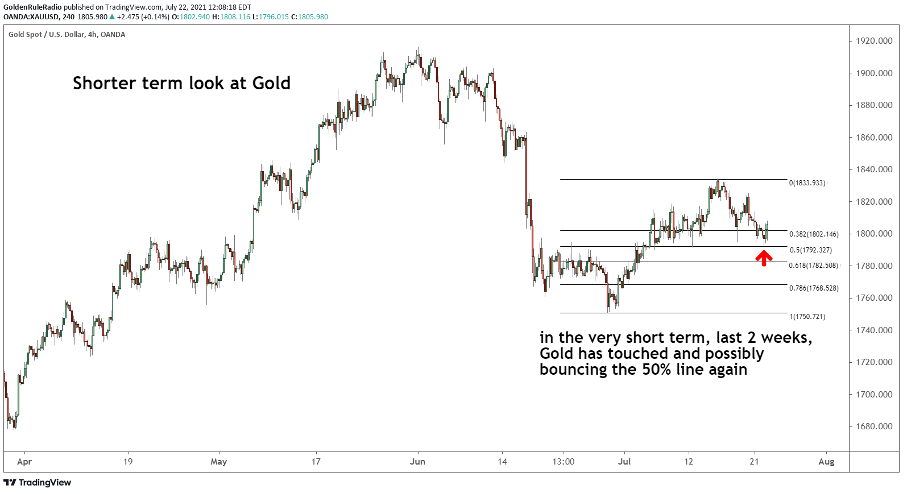
Alright, folks, let’s cut straight to the chase. The market is throwing curveballs, and you need to be prepared. Fresh broker order flow data is screaming resistance for gold. We’re seeing a cluster of potential roadblocks stacking up, especially around the 3311 level, so tread carefully if you’re long. Don’t get caught leaning the wrong way.
GBP/USD, meanwhile, is a brawl. It’s a fierce back-and-forth, a real tug-of-war between bulls and bears. This isn’t a setup for the faint of heart. Expect volatility and price swings. Position sizing is key here – don’t overextend!
And let’s not forget USD/JPY. The good news? We’ve identified three key support levels that are holding for now. But let’s be clear: this isn’t a sign to get complacent. The market can change in a heartbeat.
—
Understanding Key Support & Resistance Levels – A Quick Primer:
Support and resistance are price levels where the price tends to stop and reverse. These levels arise due to the psychology of traders.
Resistance is where selling pressure is strong enough to halt an upward trend. Think of it as a ceiling. Traders who are short will see this as an opportunity to exit their positions and take profit.
Support, conversely, is where buying pressure is strong enough to stop a downward trend. This is a market floor. Long traders eagerly wait to cover short positions or establish new long ones.
Broker order flow data gives us a glimpse into where these levels are actually forming, mirroring where institutions and big players are placing their orders. Ignoring these signals is essentially flying blind.


