Alright, folks, let’s cut straight to the chase. The latest broker positioning data is in, and it’s painting a very specific picture for us in the precious metals and FX markets. Gold, while still holding appeal, is now staring down the barrel of some significant resistance levels. We’re looking at 3258 and beyond as critical points where the rally could stall. Don’t get caught leaning the wrong way here – protect your profits!
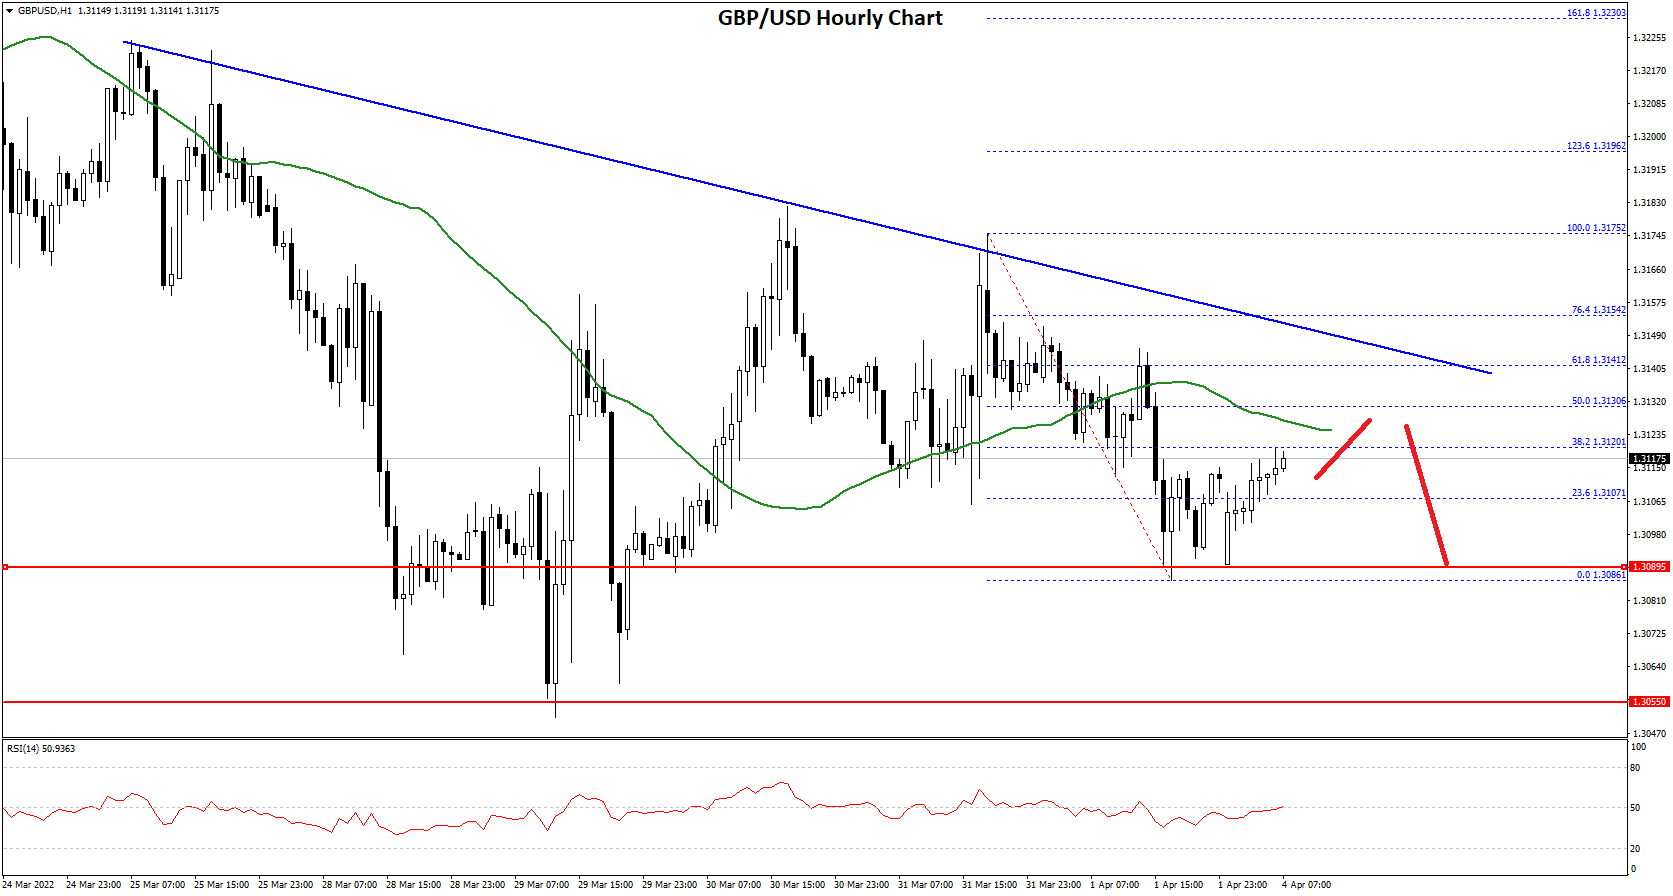
Now, let’s talk about GBP/USD. This pair is moving. The data clearly shows strong bullish momentum building around current prices. This isn’t just noise; it’s a genuine push higher. Be prepared for continued upside, but remember, no rally lasts forever.
And finally, USD/JPY. We’re seeing a lot of speculative long positioning building up. This suggests traders are betting on further yen weakness. It’s a crowded trade, which always makes me a little nervous, but the trend is your friend until it bends.
Diving Deeper: Understanding Broker Positioning Data
Broker positioning data offers a unique window into market sentiment. It reveals where traders are actually putting their money, not just what they say they believe. This is crucial.
Essentially, it tracks the net long or short positions held by brokers. A large net long position can indicate overbought conditions and potential for a correction. Conversely, a large net short position suggests potential for a bounce.
However, it’s not a foolproof system. It’s a confluence indicator, meaning it’s best used in conjunction with other technical and fundamental analysis. Don’t rely on it in isolation!
Understanding these dynamics is key to navigating these markets successfully. Stay vigilant, manage your risk, and don’t let emotion cloud your judgment. Click here to access the full report for detailed levels and analysis.