Alright, traders, let’s cut straight to the chase. The latest broker positioning data is painting a pretty concerning picture for gold. That shiny metal is looking vulnerable, with support looking incredibly flimsy. We’re eyeing key resistance points around 3243 and beyond – don’t get caught long hoping for a miracle bounce!
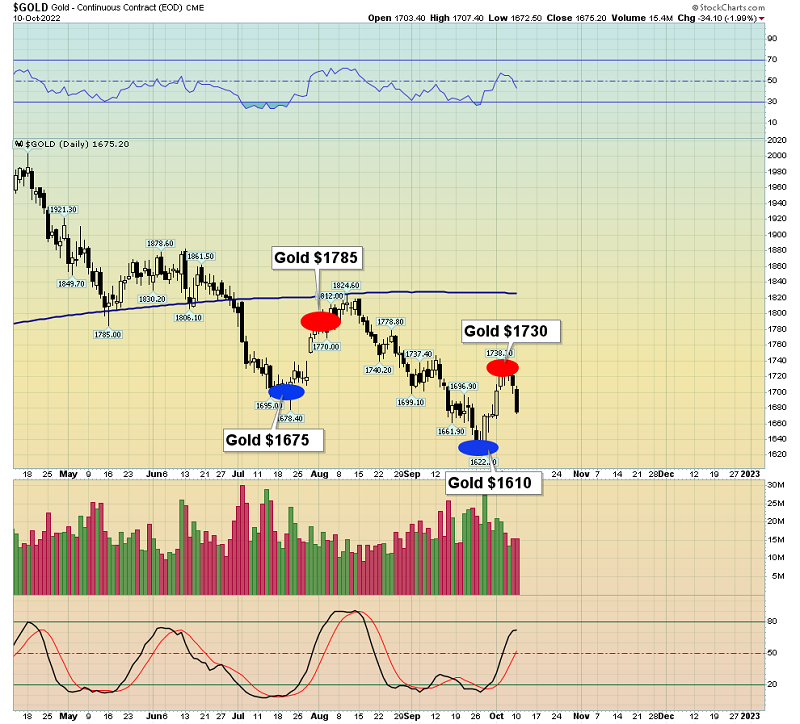
Photo source:www.gold-eagle.com
Now, let’s talk about where the real money is moving. Crude oil, and particularly GBP/USD, are showing serious bullish momentum right now. The buying pressure is palpable. Don’t fade this move without a VERY good reason.
And for those playing the USD/JPY, the majority of open interest is still weighted toward short positions within the current range. Be cautious if you’re betting against the trend here.
Digging Deeper: Understanding Broker Positioning Data
Broker positioning data, often referred to as Commitment of Traders (COT) reports, reveals the net long or short positions held by various trader groups. This insight is invaluable!
It showcases how large speculators – the smart money – are positioned in the market. Following these trends can give you an edge.
Understanding where the majority of positions lie helps assess potential market direction. It’s not foolproof, but it’s a powerful tool.
However, remember context is KEY. Don’t blindly follow the data. Consider fundamental factors and overall market sentiment, as well. The market is rarely one-dimensional.
Click here to dive into the full report for detailed charts and analysis – don’t trade blind!