Alright, folks, let’s cut straight to the chase. The market’s flashing some critical signals, and ignoring them is a quick path to losing your shirt. Latest broker order book data reveals gold is hitting a wall around the 3362 level, along with other key resistance points. Don’t be fooled by any short-term bounces – these are prime sell-offs opportunities, in my view.
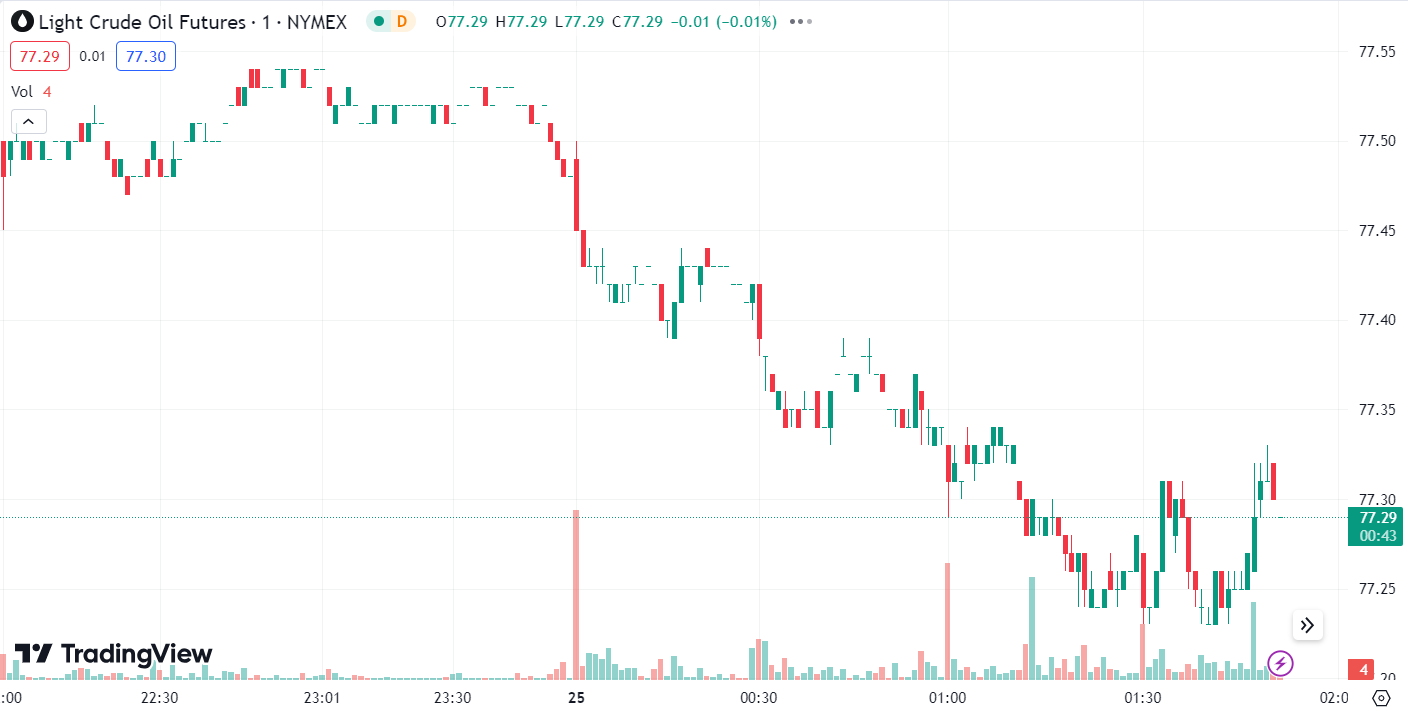
Photo source:www.dooprimenews.com
Now, over in the oil patch, sentiment’s shifting. We’re seeing a significant build-up of bullish bets, particularly around a specific upward price target. This isn’t just noise; it’s money talking. Pay attention!
And don’t sleep on the Euro/US Dollar pair – it’s showing surprisingly robust support right around current levels. This suggests a potential short-term floor, but remember, support is always tested.
Deeper Dive: Understanding Order Book Data & Support/Resistance
Order book data provides a real-time snapshot of buy and sell orders placed by brokers. Analyzing this data reveals key price levels where significant trading activity – and therefore potential reversals – are likely to occur.
Support levels represent price points where buying pressure is strong enough to prevent further declines. Resistance, conversely, highlights areas where selling pressure dominates, capping potential price increases.
These levels aren’t magic lines, but they are crucial indicators of market psychology. Smart traders watch these closely for potential entry and exit points. Pro tip: look for confluence – where multiple indicators align at the same level.
Always remember, mastering technical analysis requires experience, discipline, and a healthy dose of skepticism. Don’t just follow signals blindly; understand why they’re forming. For the full report with specific entry/exit strategies, click here!