Alright, traders, let’s cut through the noise and get straight to the critical levels flashing on broker order books right now. We’re seeing some serious resistance stacking up around the $3307 mark for gold. Don’t be a hero trying to chase this rally blindly – price action suggests a potential pullback is looming.
Now, GBP/USD – things get a little more interesting. We’re spotting two distinct pockets of buying pressure brewing above. This doesn’t mean it’s a free ride higher, but the odds for further upside are definitely improving. Position carefully and manage your risk!
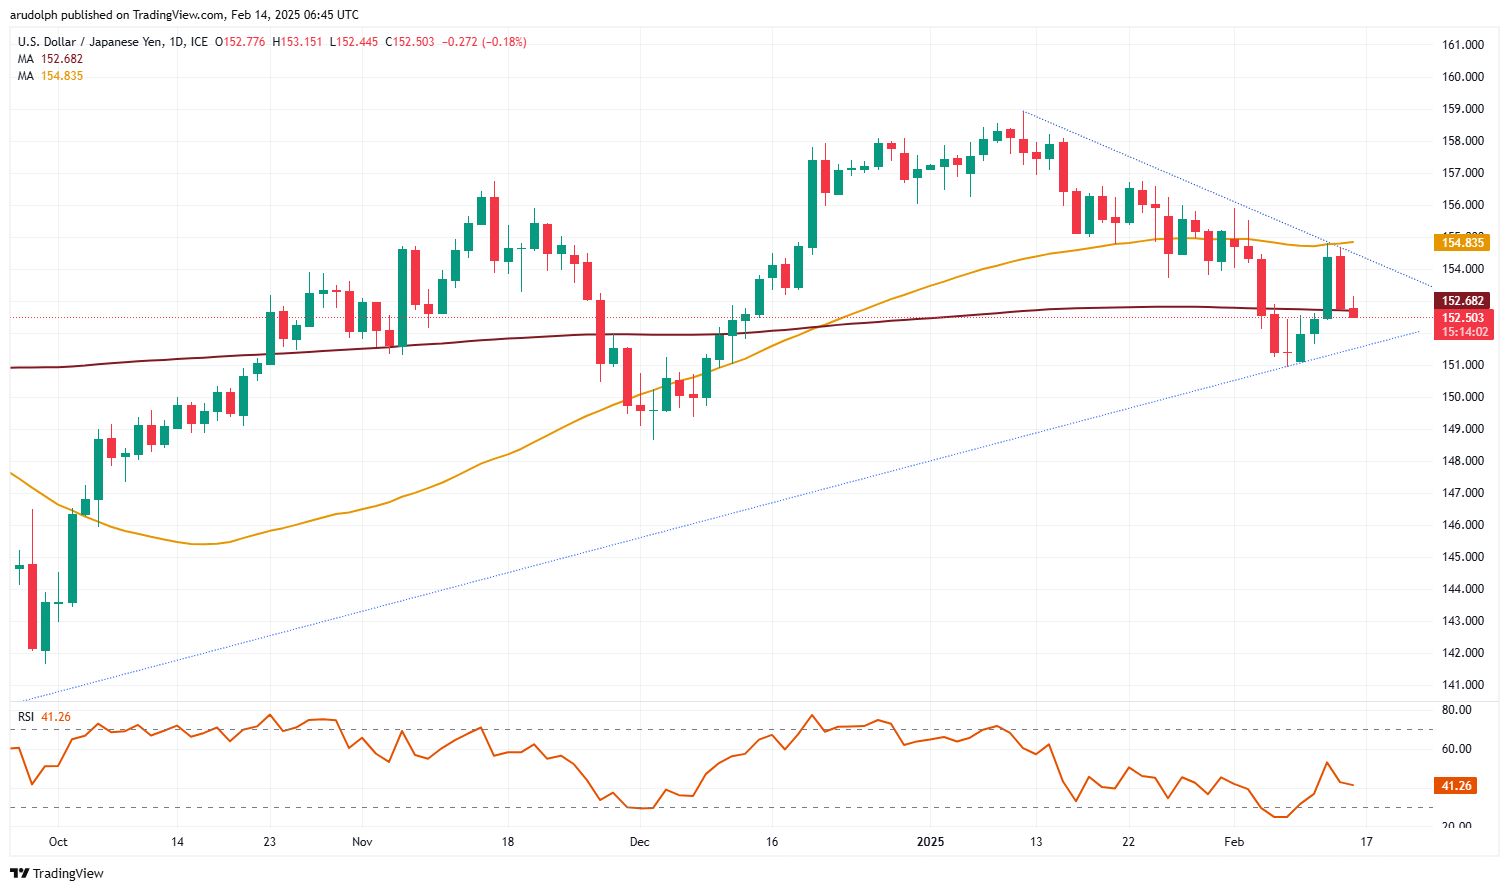
And let’s talk USD/JPY. This pair is a minefield, folks. I’m seeing two significant layers of stops being targeted by potential shorts. Traders are aggressively positioning for a decline, and you need to be aware of where those traps are laid. Don’t let the bears shake you out unnecessarily!
Expanding on the Fundamentals: Understanding Broker Order Book Data
Broker order book data provides a real-time glimpse into the collective intentions of market participants. It reveals where large buy and sell orders are clustered, indicating potential support and resistance levels. These levels aren’t set in stone, but are significant zones.
Analyzing this data allows informed traders to anticipate potential price reactions and avoid getting caught on the wrong side of swift moves. It’s about understanding where the ‘smart money’ is positioned, not just following momentum.
Pay close attention to areas where large orders are building. These indicate strong conviction and can act as powerful barriers to price movement. Ignoring them is trading with your eyes closed and can quickly diminish capital.
Remember, this is just one piece of the puzzle. Confirmation from other technical indicators and fundamental analysis is crucial for a robust trading strategy. Don’t just blindly follow the levels, understand the why behind them.